
Located in:
- II. Strategic Elements
The Unified or Combined State Plan must include a Strategic Planning Elements section that analyzes the State’s current economic environment and identifies the State’s overall vision for its workforce development system. The required elements in this section allow the State to develop data-driven goals for preparing an educated and skilled workforce and to identify successful strategies for aligning workforce development programs. Unless otherwise noted, all Strategic Planning Elements apply to Combined State Plan partner programs included in the plan as well as to core programs.
- a. Economic, Workforce, and Workforce Development Activities Analysis
The Unified or Combined State Plan must include an analysis of the economic conditions, economic development strategies, and labor market in which the State’s workforce system and programs will operate.
- a. Economic, Workforce, and Workforce Development Activities Analysis
II. a. 1. A. Economic Analysis (A.I -A.III)
The Unified or Combined State Plan must include an analysis of the economic conditions and trends in the State, including sub-State regions and any specific economic areas identified by the State. This must include-
i. Existing Demand Industry Sectors and Occupations
Provide an analysis of the industries and occupations for which there is existing demand.
ii. Emerging Industry Sectors and Occupation
Provide an analysis of the industries and occupations for which demand is emerging.
iii. Employers’ Employment Needs
With regard to the industry sectors and occupations identified in 1 and 2 above, provide an assessment of the employment needs of employers, including a description of the knowledge, skills, and abilities required, including credentials and licenses.
Current Narrative:
Existing Demand Industry Sectors
As of November 2017, industries with the most demand were all services-producing industries with trade, transportation and utilities generating the most demand (1,767,600 jobs), followed by professional and business services (1,342,800 jobs), education and health services (1,276,900 jobs) and leisure and hospitality (1,197,700 jobs). Construction (+8.7 percent) and manufacturing (+3.9 percent) were the fastest growing major industries over the year.
As of November 2017, the national annual growth rates (seasonally adjusted) in construction (+2.8 percent), manufacturing (+1.5 percent), trade, transportation and utilities (+0.4 percent), information (-1.9 percent), financial activities (+1.8 percent), professional and business services (+2.7 percent), other services (+1.4 percent) and government (+0.2 percent) were less than the expansion rates for Florida.
In November 2017, Florida (+2.3 percent) had the second strongest over-the-year growth rate in total nonagricultural employment among the 10 most populous states, behind Texas (+2.7 percent). Among all states, Florida ranked fourth in over-the-year growth rate.
Figure 2.01
Nonagricultural Employment in Florida, Seasonally Adjusted
| Industry Title | November 2017 | October2017 | November 2016 | Over the Month Change Level | Over the Month Change % | Over the Year Change Level | Over the Year Change % |
|---|---|---|---|---|---|---|---|
| Total Nonagricultural Employment | 8,676,400 | 8,663,300 | 8,481,400 | 13,100 | 0.2 | 195,000 | 2.3 |
| Total Private | 7,565,700 | 7,551,800 | 7,382,900 | 13,900 | 0.2 | 182,800 | 2.5 |
| Goods Producing | 902,900 | 896,500 | 847,000 | 6,400 | 0.7 | 55,900 | 6.6 |
| Mining, Logging and Construction | 530,300 | 524,000 | 488,500 | 6,300 | 1.2 | 41,800 | 8.6 |
| Construction | 524,600 | 518,400 | 482,800 | 6,200 | 1.2 | 41,800 | 8.7 |
| Manufacturing | 372,600 | 372,500 | 358,500 | 100 | * | 14,100 | 3.9 |
| Durable Goods | 256,900 | 255,800 | 243,400 | 1100 | 0.4 | 13,500 | 5.5 |
| Nondurable Goods | 115,700 | 116,700 | 115,100 | -1000 | -0.9 | 600 | 0.5 |
| Service Providing | 7,773,500 | 7,766,800 | 7,634,400 | 6,700 | 0.1 | 139,100 | 1.8 |
| Private Service Providing | 6,662,800 | 6,655,300 | 6,535,900 | 7500 | 0.1 | 126,900 | 1.9 |
| Trade, Transportation and Utilities | 1,767,600 | 1,762,100 | 1,734,100 | 5500 | 0.3 | 33,500 | 1.9 |
| Wholesale Trade | 354,000 | 353,000 | 338,800 | 1,000 | 0.3 | 15,200 | 4.5 |
| Retail Trade | 1,125,600 | 1,123,600 | 1,114,200 | 2,000 | 0.2 | 11,400 | 1 |
| Transportation, Warehousing and Utilities | 288,000 | 285,500 | 281,100 | 2500 | 0.9 | 6,900 | 2.5 |
| Information | 141,000 | 139,800 | 138,000 | 1,200 | 0.9 | 3,000 | 2.2 |
| Financial Activities | 567,400 | 562,200 | 551,900 | 5,200 | 0.9 | 15,500 | 2.8 |
| Finance and Insurance | 374,200 | 372,100 | 369,800 | 2,100 | 0.6 | 4,400 | 1.2 |
| Real Estate, Rental and Leasing | 193,200 | 190,100 | 182,100 | 3,100 | 1.6 | 11,100 | 6.1 |
| Professional and Business Services | 1,342,800 | 1,348,500 | 1,301,800 | -5,700 | -0.4 | 41,000 | 3.1 |
| Professional and Technical Services | 556,800 | 557,900 | 536,400 | -1100 | -0.2 | 20,400 | 3.8 |
| Management of Companies and Enterprises | 105,200 | 104,800 | 102,500 | 400 | 0.4 | 2,700 | 2.6 |
| Administrative and Waste Services | 680,800 | 685,800 | 662,900 | -5,000 | -0.7 | 17,900 | 2.7 |
| Education and Health Services | 1,276,900 | 1,275,300 | 1,261,700 | 1,600 | 0.1 | 15,200 | 1.2 |
| Educational Services | 159,900 | 157,700 | 160,100 | 2200 | 1.4 | -200 | -0.1 |
| Health Care and Social Assistance | 1,117,000 | 1,117,600 | 1,101,600 | -600 | -0.1 | 15,400 | 1.4 |
| Leisure and Hospitality | 1,197,700 | 1,195,900 | 1,192,500 | 1,800 | 0.2 | 5,200 | 0.4 |
| Arts, Entertainment and Recreation | 221,900 | 224,700 | 223,500 | -2,800 | -1.2 | -1,600 | -0.7 |
| Accommodation and Food Services | 975,800 | 971,200 | 969,000 | 4,600 | 0.5 | 6,800 | 0.7 |
| Other Services | 369,400 | 371,500 | 355,900 | -2,100 | -0.6 | 13,500 | 3.8 |
| Total Government | 1,110,700 | 1,111,500 | 1,098,500 | -800 | -0.1 | 12,200 | 1.1 |
| Federal | 139,100 | 139,800 | 138,700 | -700 | -0.5 | 400 | 0.3 |
| State | 212,300 | 212,600 | 212,500 | -300 | -0.1 | -200 | -0.1 |
| Local | 759,300 | 759,100 | 747,300 | 200 | * | 12,000 | 1.6 |
Source: Florida Department of Economic Opportunity, Bureau of Labor Market Statistics, Current Employment Statistics, December 2015
Existing Demand Occupations
Existing demand occupations are occupations that have the highest number of projected total job openings. Starting with the release of the 2017-2025 projections, job openings will be calculated using the new Separations Method. Total job openings reflect (1) job openings resulting from employment growth, (2) job openings resulting from workers permanently exiting an occupation and (3) job openings resulting from workers transferring to other occupations. In most occupations, replacement needs provide many more job openings than employment growth does.
Existing demand occupations tend to be occupations that serve the most basic societal needs. The most common existing demand occupations in the U.S. labor market are low-skill, hourly wage occupations with high turnover. Florida follows the national pattern, with common existing demand occupations in the state, including retail salespersons, food preparation and serving workers, waiters and waitresses, and cashiers. Some existing demand occupations in Florida are relatively high skill. Such occupations include registered nurses, accountants and auditors and elementary school teachers.
The top five existing demand occupations for Florida statewided are related to customer service and hospitality. Retail salesperson is the top existing demand occupation, with 482,959 projected total job openings between 2017 and 2025. Two of the top existing demand occupations are healthcare occupations: registered nurses and nursing assistants, which have a relatively high turnover rate and will experience employment growth because of the increasing demand for healthcare services, driven by population growth and aging, expanding insurance coverage and technological change. Only two of the top existing demand occupations require significant technical training: registered nurses and accountants and auditors.
The following table displays the top 15 existing demand occupations (based on 2017-2025 total job openings) for Florida statewide.
Figure 2.02
Top 15 Existing Demand Occupations
| Code | Occupation | 2017 Employment | 2025 Employment | 2017-25 Level Change | 2017-25 Percent Change | 2017-25 Total Job openings | 2017 Median Hourly Wage | 2017 Entry Wage | 2017 Experienced Wage | |
|---|---|---|---|---|---|---|---|---|---|---|
| 1 | 412031 | Retail Salespersons | 351,545 | 397,545 | 46,000 | 13.09 | 482,959 | 10.36 | 8.9 | 14.21 |
| 2 | 353021 | Combined Food Prep. and Serving Workers, Inc. Fast Food | 238,814 | 277,504 | 38,690 | 16.20 | 417,337 | 9.47 | 9.14 | 10.44 |
| 3 | 412011 | Cashiers | 248,045 | 261,482 | 13,437 | 5.42 | 391,038 | 9.31 | 8.88 | 10.48 |
| 4 | 353031 | Waiters and Waitresses | 226,204 | 247,019 | 20,815 | 9.20 | 374,691 | 10.03 | 9.13 | 15.49 |
| 5 | 434051 | Customer Service Representatives | 244,276 | 278,142 | 33,866 | 13.86 | 289,913 | 14.43 | 10.65 | 17.78 |
| 6 | 436014 | Secretaries, Except Legal, Medical and Executive | 194,145 | 211,512 | 17367 | 8.95 | 182,226 | 15.78 | 11.44 | 19.05 |
| 7 | 439061 | Office Clerks, General | 173,867 | 188,359 | 14,492 | 8.34 | 177,435 | 13.4 | 9.78 | 17.06 |
| 8 | 537062 | Laborers and Freight, Stock and Material Movers, Hand | 132,364 | 146,186 | 13,822 | 10.44 | 163,604 | 11.92 | 9.58 | 15.32 |
| 9 | 435081 | Stock Clerks and Order Fillers | 140,166 | 152,582 | 12,416 | 8.86 | 161,332 | 11.59 | 9.58 | 14.08 |
| 10 | 372011 | Janitors and Cleaners, Except Maids and Housekeeping | 131,143 | 147,628 | 16,485 | 12.57 | 160,755 | 10.60 | 9.15 | 12.70 |
| 11 | 352014 | Cooks, Restaurant | 105,686 | 125,554 | 19,868 | 18.8 | 151,110 | 12.55 | 10.20 | 14.42 |
| 12 | 373011 | Landscaping and Grounds keeping Workers | 115,326 | 130,911 | 15,585 | 13.51 | 131,690 | 11.74 | 9.94 | 13.84 |
| 13 | 372012 | Maids and Housekeeping Cleaners | 95,320 | 107,252 | 11,932 | 12.52 | 121,572 | 10.34 | 9.15 | 11.73 |
| 14 | 311014 | Nursing Assistants | 96,804 | 114,430 | 17,626 | 18.21 | 115,808 | 12.15 | 10.59 | 13.50 |
| 15 | 291141 | Registered Nurses | 188,202 | 218,508 | 30,306 | 16.1 | 113,795 | 30.79 | 24.84 | 35.18 |
Source: Florida Department of Economic Opportunity, Bureau of Labor Market Statistics, December 2017
(ii) Emerging Demand Industry Sectors and Occupations
Emerging Demand Industries
Figure 2.03
Top Emerging Industries
| Code | Title | 2017 Employment | 2025 Employment | 2017-25 Total Change | 2017-25 Percent |
|---|---|---|---|---|---|
| 621900 | Other Ambulatory Health Care Services | 14,156 | 18,467 | 4,311 | 30.5% |
| 454100 | Electronic Shopping and Mail-Order Houses | 29,722 | 37,825 | 8,103 | 27.3% |
| 611205 | Private Junior Colleges | 5,616 | 6,877 | 1,261 | 22.5% |
| 621500 | Medical and Diagnostic Laboratories | 22,878 | 27,857 | 4,979 | 21.8% |
| 611700 | Educational Support Services | 7,082 | 8,561 | 1,479 | 20.9% |
| 622305 | Private Specialty (Except Psychiatric and Substance Abuse) | 15,297 | 18,274 | 2,977 | 19.5% |
| 523900 | Other Financial Investment Activities | 20,804 | 24,773 | 3,969 | 19.1% |
| 511200 | Software Publishers | 14,073 | 16,523 | 2,450 | 17.4% |
| 541700 | Scientific Research and Development Services | 18,215 | 21,385 | 3,170 | 17.4% |
| 532400 | Commercial and Industrial Machinery and Equipment Rental and Leasing | 9,635 | 11,272 | 1,637 | 17.0% |
| 517400 | Satellite Telecommunications | 643 | 752 | 109 | 17.0% |
| 327300 | Cement and Concrete Product Manufacturing | 15,065 | 17,618 | 2,553 | 16.9% |
| 423300 | Lumber and Other Construction Materials Merchant Wholesalers | 15,003 | 17,528 | 2,525 | 16.8% |
| 519100 | Other Information Services | 6,858 | 7,998 | 1,140 | 16.6% |
| 623200 | Residential Mental Retardation, Mental Health and Substance Abuse Facilities | 22,836 | 26,530 | 3694 | 16.2% |
| 334300 | Audio and Video Equipment Manufacturing | 936 | 1,087 | 151 | 16.1% |
| 492200 | Local Messengers and Local Delivery | 3,676 | 4,266 | 590 | 16.1% |
| 622205 | Private Psychiatric and Substance Abuse Hospitals | 10,814 | 12,542 | 1,728 | 16.0% |
| 488900 | Other Support Activities for Transport | 2,410 | 2,776 | 366 | 15.2% |
| 332500 | Hardware Manufacturing | 514 | 592 | 78 | 15.2% |
Source: Florida Department of Economic Opportunity, Bureau of Labor Market Statistics, December 2017
Emerging Occupations
Emerging occupations consist of (1) new occupations in the workforce and (2) traditional occupations whose requisite knowledge, skills and abilities are currently evolving in response to altered market conditions, new technology and societal changes.
Some of the factors that cause occupations to emerge are changing technology, laws, demographics and business practices. In Florida, the fastest growing among the emerging occupations are statisticians, solar photovoltaic installers, nurse practitioners, cartographers and photogrammetrists. The most common industry sectors for emerging occupations are healthcare and professional services, due to ongoing advances in medical technology; life, physical and environmental sciences; engineering, mathematics and computer sciences; and psychology and the social sciences.
Most top emerging occupations occur in the healthcare (11 of top 20) and professional services (6 of top 20).
The growth in healthcare sector emerging occupations reflects an increasing demand for medical services due to population aging, expanding medical insurance coverage and technological innovation.
The following table shows the top 20 emerging occupations for Florida statewide. This list is based on 2017-2025 projections of percent job growth for occupations with less than the average employment level.
Figure 2.04
Top Emerging Occupations
| Rank | Code | Occupation | 2017 Employment | 2025 Employment | 2017-25 Level change | 2017-25 Percent Change | Industry Sector Linkage | 2017 Median Hourly Wage | 2017 Entry Wage | 2017 Experienced Wage |
|---|---|---|---|---|---|---|---|---|---|---|
| 1 | 152041 | Statisticians | 931 | 1,307 | 376 | 40.4 | Professional Services | 30.01 | 19.85 | 41.02 |
| 2 | 472231 | Solar Photovoltaic Installers | 928 | 1,271 | 343 | 37.0 | Clean Tech | 14.93 | 12.76 | 17.73 |
| 3 | 291171 | Nurse Practitioners | 9,504 | 12,801 | 3,297 | 34.7 | Healthcare | 46.25 | 37.17 | 51.86 |
| 4 | 171021 | Cartographers and Photogrammetrists | 579 | 775 | 196 | 33.9 | Professional Services | 29.04 | 17.09 | 37.24 |
| 5 | 291071 | Physician Assistants | 5,631 | 7,512 | 1,881 | 33.4 | Healthcare | 48.62 | 38.38 | 56.82 |
| 6 | 312011 | Occupational Therapy Assistants | 2,262 | 3,005 | 743 | 32.8 | Healthcare | 31.07 | 23.64 | 34.11 |
| 7 | 499092 | Commercial Divers | 491 | 647 | 156 | 31.8 | Professional Services | 19.41 | 13.71 | 29.12 |
| 8 | 312021 | Physical Therapist Assistants | 5,482 | 7,208 | 1,726 | 31.5 | Healthcare | 30.60 | 24.28 | 34.58 |
| 9 | 473011 | Helpers--Brickmasons, Blockmasons, Stonemasons and Tile and Marble Setters | 1,159 | 1,477 | 318 | 27.4 | Construction | 11.50 | 9.67 | 13.36 |
| 10 | 299092 | Genetic Counselors | 110 | 140 | 30 | 27.3 | Healthcare | 36.22 | 19.70 | 43.75 |
| 11 | 472171 | Reinforcing Iron and Rebar Workers | 1009 | 1284 | 275 | 27.3 | Construction | 18.06 | 14.22 | 22.15 |
| 12 | 312022 | Physical Therapist Aides | 2,640 | 3,352 | 712 | 27.0 | Healthcare | 12.57 | 10.76 | 13.89 |
| 13 | 273091 | Interpreters and Translators | 2,978 | 3,766 | 788 | 26.5 | Professional Services | 17.23 | 9.61 | 26.27 |
| 14 | 152031 | Operations Research Analysts | 6,634 | 8,368 | 1734 | 26.1 | Professional Services | 29.51 | 19.77 | 37.80 |
| 15 | 292032 | Diagnostic Medical Sonographers | 5,723 | 7,205 | 1,482 | 25.9 | Healthcare | 30.40 | 24.58 | 33.85 |
| 16 | 291151 | Nurse Anesthetists | 2,245 | 2,825 | 580 | 25.8 | Healthcare | 72.38 | 49.52 | 95.57 |
| 17 | 151134 | Web Developers | 9,752 | 12,248 | 2,496 | 25.6 | Professional Services | 28.26 | 18.75 | 36.52 |
| 18 | 291061 | Anesthesiologists | 2,380 | 2,985 | 605 | 25.4 | Healthcare | NR | NR | NR |
| 19 | 292057 | Ophthalmic Medical Technicians | 3,466 | 4,345 | 879 | 25.4 | Healthcare | 17.61 | 13.97 | 19.82 |
| 20 | 291181 | Audiologists | 742 | 930 | 188 | 25.3 | Healthcare | 35.58 | 23.55 | 41.34 |
Source: Florida Department of Economic Opportunity, Bureau of Labor Market Statistics, December 2017
(iii) Employers’ Employment Needs
The needs of employers with respect to knowledge, skills and abilities (KSAs) are provided for each occupation in the labor market by the O*Net system (see https://www.onetonline.org/).
By using the content in the O*Net database, it is possible to analyze the knowledge, skills and abilities for individual occupations, occupational groups, or targeted occupations. The following is an analysis of occupations that are emerging, have rapid growth and have numerous job openings. O*Net level and importance scores for the various KSAs were matched to the relevant occupational groups. The level and importance score were added together and standardized to a 100-point scale. The following nine graphs show the knowledge, skills and abilities for (1) emerging occupations, (2) occupations with numerous job openings and (3) rapid growth occupations as defined in the O*Net system.
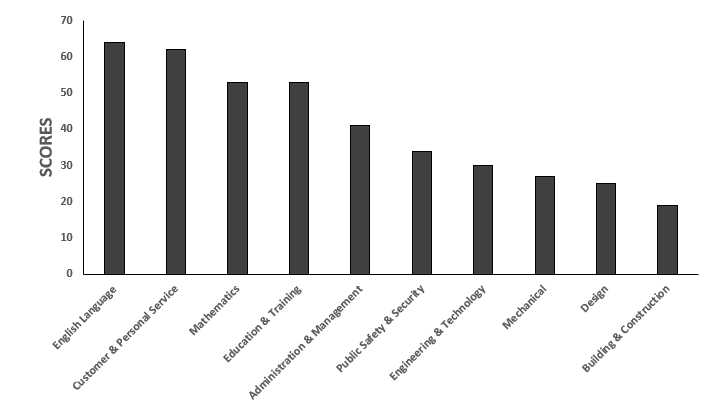
The highest KSAs for emerging occupations are knowledge of English Language, Customer & Personal Service, Active Listening, Reading Comprehension, Oral Comprehension and Oral Expression.
Figure 2.05 Emerging Occupations - Top Knowledge Scores can be viewed online at https://careersourceflorida.com/Emerging_Occupations-Top_Knowledge_Scores.png. This graph displays the knowledge components that were reported most important for Emerging Occupations. Knowledge of English Language and Customer & Personal Service were identified as most important for the Emerging Occupations. English Language 64, Customer & Personal Service 62, Mathematics 53, Education & Training 53, Administration & Management 41, Public Safety & Security 34, Engineering & Technology 30, Mechanical 27, Design 25, Building & Construction 19.
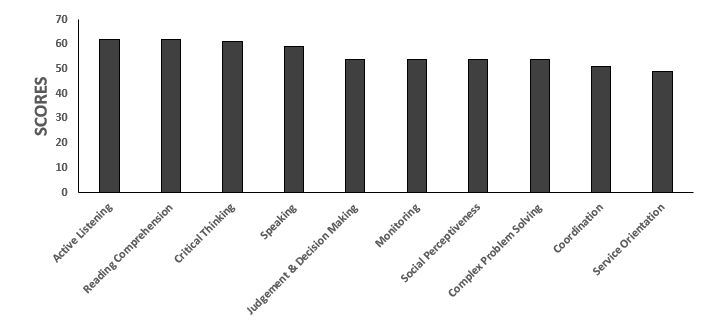
Figure 2.06 Emerging Occupations - Top Skills Scores can be viewed online at https://careersourceflorida.com/Emerging_Occupations-Top_Skills_Scores.png. This graph displays the skills components that were reported most important for Emerging Occupations. Skills in Active Listening and Reading Comprehension were identified as most important for the Emerging Occupations. Active Listening 62, Reading Comprehension 62, Critical Thinking 61, Speaking 59, Judgement & Decision Making 54, Monitoring 54, Social Perceptiveness 54, Complex Problem Solving 54, Coordination 51, Service Orientation 49.
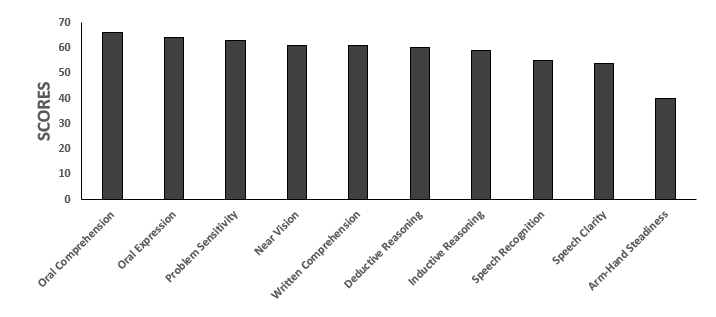
Figure 2.07 Emerging Occupations - Top Abilities Scores can be viewed online at https://careersourceflorida.com/Emerging_Occupations-Top_Abilities_Scores.png. This graph displays the ability components that were reported most important for Emerging Occupations. Abilities of Oral Comprehension and Oral Expression were identified as most important for the Emerging Occupations. Oral Comprehension 66, Oral Expression 64, Problem Sensitivity 63, Near Vision 61, Written Comprehension 61, Deductive Reasoning 60, Inductive Reasoning 59, Speech Recognition 55, Speech Clarity 54, Arm-Hand Steadiness 40.
The highest KSAs for occupations with the most job openings are knowledge of Customer & Personal Service, English Language, Active Listening, Speaking, Oral Comprehension and Oral Expression.
Figure 2.08 Occupations with Most Job Openings - Top Knowledge Scores can be viewed online at https://careersourceflorida.com/Occupations_with_Most_Job_Openings-Top_Knowledge_Scores.png. This graph displays the knowledge components that were reported most important for Occupations with the Most Job Openings. Knowledge of Customer & Personal Service and English Language were identified as most important for Occupations with the Most Job Openings. Customer & Personal Service 65, English Language 58, Administration & Management 47, Mathematics 46, Education & Training 46, Public Safety & Security 38, Mechanical 24, Engineering & Technology 23, Design 21, Building & Construction 17.
Figure 2.09 Occupations with Most Job Openings - Top Skills Scores can be viewed online at https://careersourceflorida.com/Occupations_with_Most_Job_Openings-Top_Skills_Scores.png. This graph displays the skills components that were reported most important for Occupations with the Most Job Openings. Skills in Active Listening and Speaking were identified as most important for Occupations with the Most Job Openings. Active Listening 57, Speaking 55, Critical Thinking 53, Reading Comprehension 53, Monitoring 50, Social Perceptiveness 50, Coordination 50, Service Orientation 49, Judgement & Decision Making 48, Complex Problem Solving 46.
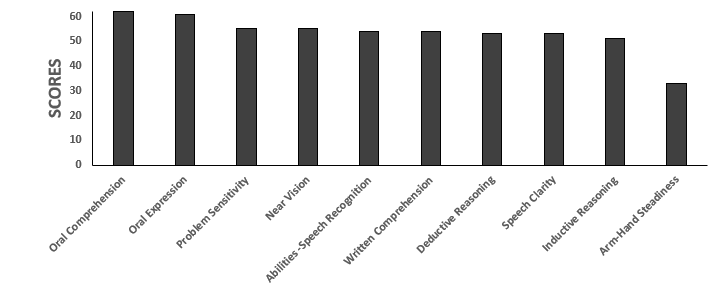
Figure 2.10 Occupations with Most Job Openings - Top Abilities Scores: can be viewed online at https://careersourceflorida.com/Occupations_with_Most_Job_Openings-Top_Abilities_Scores.png. This graph displays the ability components that were reported most important for Occupations with the Most Job Openings. Abilities of Oral Comprehension and Oral Expression were identified as most important for Occupations with the Most Job Openings. Oral Comprehension 62, Oral Expression 61, Problem Sensitivity 55, Near Vision 55, Abilities -Speech Recognition 54, Written Comprehension 54, Deductive Reasoning 53, Speech Clarity 53, Inductive Reasoning 51, Arm-Hand Steadiness 33.
The highest KSAs for occupations with the most job openings are knowledge of Customer & Personal Service, English Language, Active Listening, Critical Thinking, Oral Comprehension and Oral Expression.
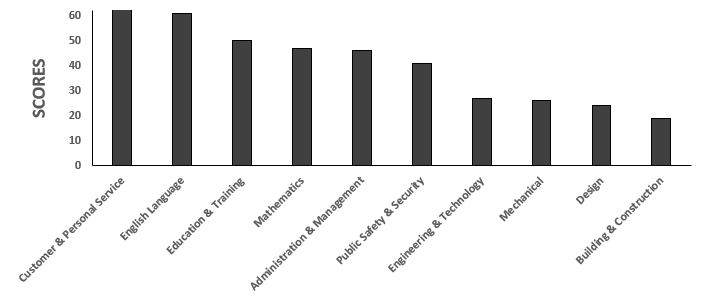
Figure 2.11 Rapid Growth Occupations - Top Knowledge Scores: can be viewed online at https://careersourceflorida.com/Rapid_Growth_Occupations-Top_Knowledge_Scores.png. This graph displays the knowledge components that were reported most important for Rapid Growth Occupations. Knowledge of Customer & Personal Service and English Language were identified as most important for Rapid Growth Occupations. Customer & Personal Service 67, English Language 61, Education & Training 50, Mathematics 47, Administration & Management 46, Public Safety & Security 41, Engineering & Technology 27, Mechanical 26, Design 24, Building & Construction 19.
Figure 2.12 Rapid Growth Occupations - Top Skills Scores: can be viewed online at https://careersourceflorida.com/Rapid-Growth-Occupations-Top-Skills-Scores.png. This graph displays the skills components that were reported most important for Rapid Growth Occupations. Skills in Active Listening and Critical Thinking were identified as most important for Rapid Growth Occupations. Active Listening 59, Critical Thinking 57, Speaking 57, Reading Comprehension 56, Monitoring 53, Social Perceptiveness 52, Judgement & Decision Making 51, Coordination 51, Service Orientation 50, Complex Problem Solving 49.
Figure 2.13 Rapid Growth Occupations - Top Abilities Scores can be viewed online at https://careersourceflorida.com/Rapid-Growth-Occupations-Top-Abilities-Scores.png. This graph displays the ability components that were reported most important for Rapid Growth Occupations. Abilities of Oral Comprehension and Oral Expression were identified as most important for Rapid Growth Occupations. Oral Comprehension 64, Oral Expression 63, Problem Sensitivity 60, Near Vision 58, Deductive Reasoning 57, Written Comprehension 57, Inductive Reasoning 55, Speech Recognition 55, Speech Clarity 54, Arm-Hand Steadiness 37.